Flooding causes more damage in the United States than any other weather-related event, and can occur in any of the 50 states including U.S. territories at any time of the year. Not all states have the same exposure to storms however.
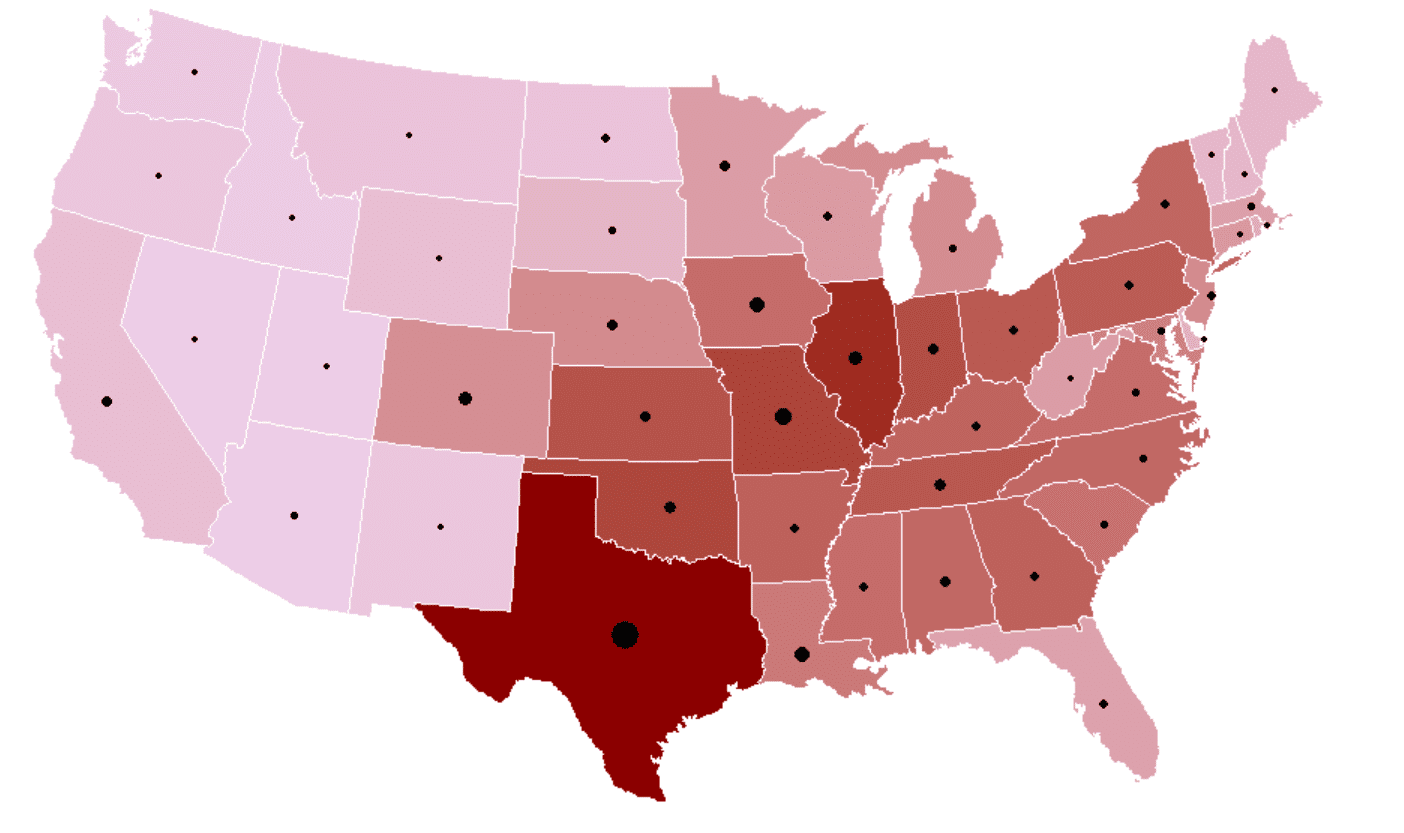
Let’s take a closer look at a US flood risk map. The risk map shows the frequency and financial cost of storms between 1980-2019 across the US. The darker the red color the higher the storm frequency in the state; the larger the black dot the higher the cost of the storms. Texas and Illinois stand out for having more storms than any other US states since 1980. Texas however, also tops the list in terms of the financial cost of these storms.
Harvey Flood In Houston, Texas
In 2017 Harvey hit Houston, Texas with a flood of biblical proportions causing an estimated $8 billion in damage across the region. Harvey is officially the wettest storm in US history and floods of this proportion are expected to hit once in a 1000 years. However Harvey was followed by Imelda after just 2 years. Imelda is officially the fifth wettest storm in US history and in normal circumstances should not have arrived for at least another 500 years!
Unfortunately things are not expected to get any better for Texas or the rest of the US when it comes to future extreme storms. Climate studies predict a significant increase in extreme storms going forward in all regions in the US, even those regions where total precipitation is projected to decline, such as the southwestern United States. If we fail to address climate change by cutting down carbon emissions significantly the number of extreme events (exceeding a 5-year return period) are projected to increase by two to three times the historical average in every region by the end of the 21st century, with the largest increases in the Northeast.
Locating Defects in The Water Drainage Infrastructure
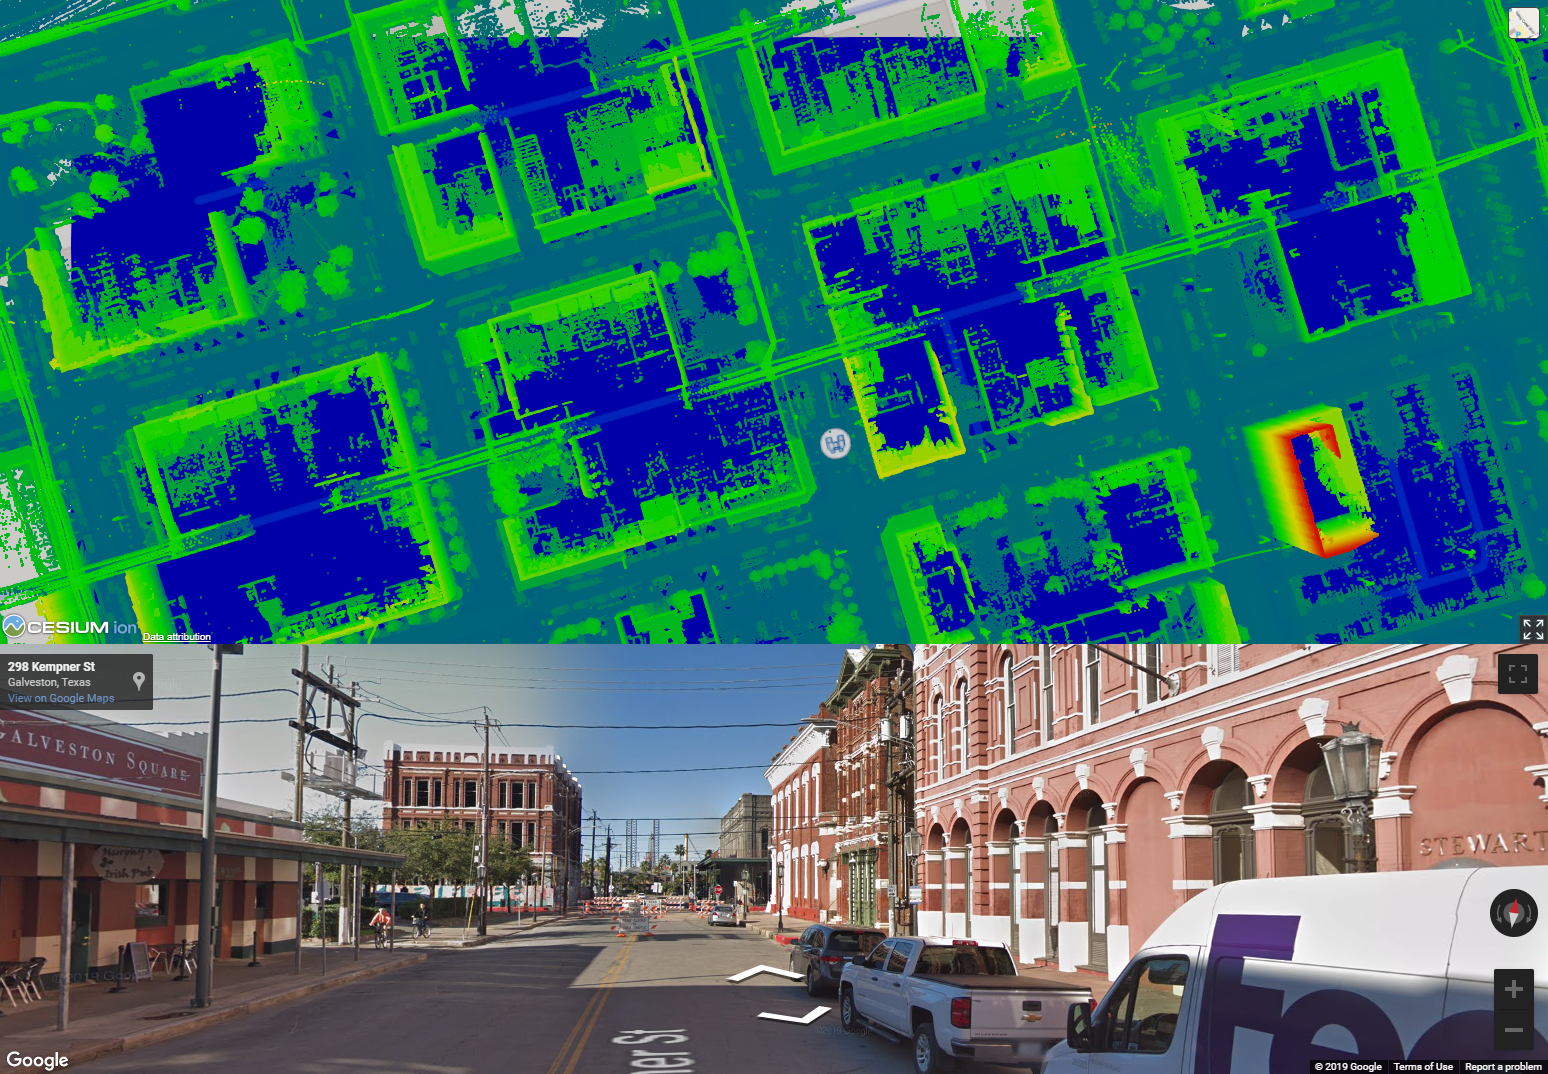
Houston is the largest city in Texas and a test case for the US in its struggle against climate change. To get a sense of the enormity of challenge facing Houston, a recent study found that 17 percent (or 1.2 million people) of the Houston metropolitan population is exposed to flooding. New Orleans suffered a fearsome flood in 2005 but New Orleans has large areas lying below sea-level and only defense repair and pumping can remove the flood water which poses a very different challenge. This is not the case for Houston, a enormous city comfortably above sea-level.
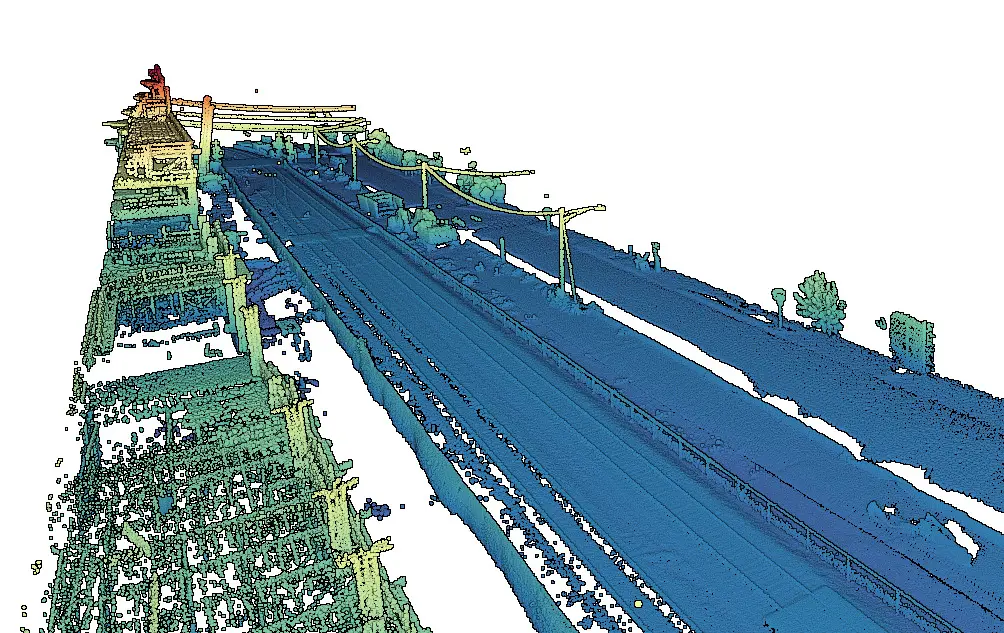
In Houston a series of slow-moving bayous, provide natural drainage. Houston has also built drainage channels including, on-road and off-road ditches to hold or move water away from local areas. In 2017 the City of Houston’s Public Works and Engineering department partnered with Reality IMT in a novel approach to enable imaging and mapping of it’s storm drain infrastructure, in an effort to rapidly pin point the location of defects along it’s off-road ditches.
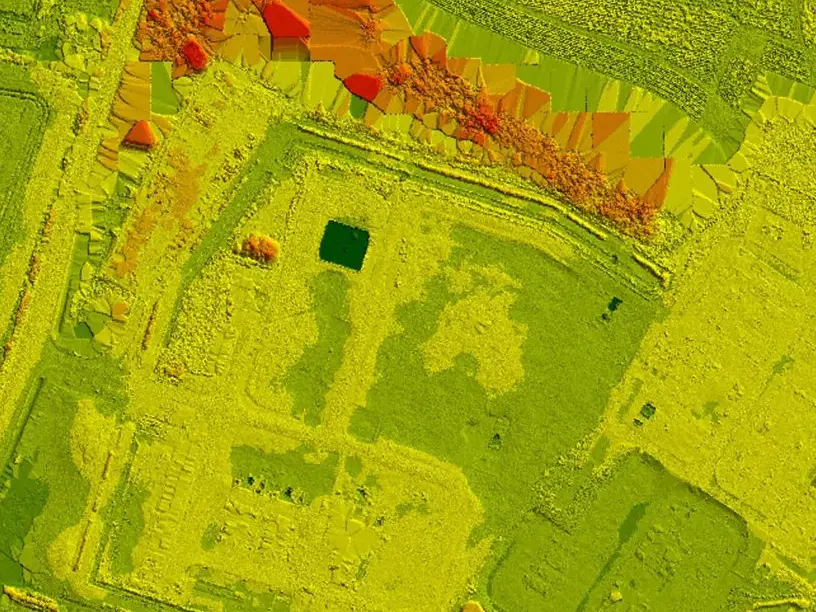
Using Geovideo, Reality IMT was able to to visually document, map, and geotag defects along the ditches. Let’s take a closer look at these defects on the heat map below. The red points indicate the location of defects – the darker the red the more excessive the defect.
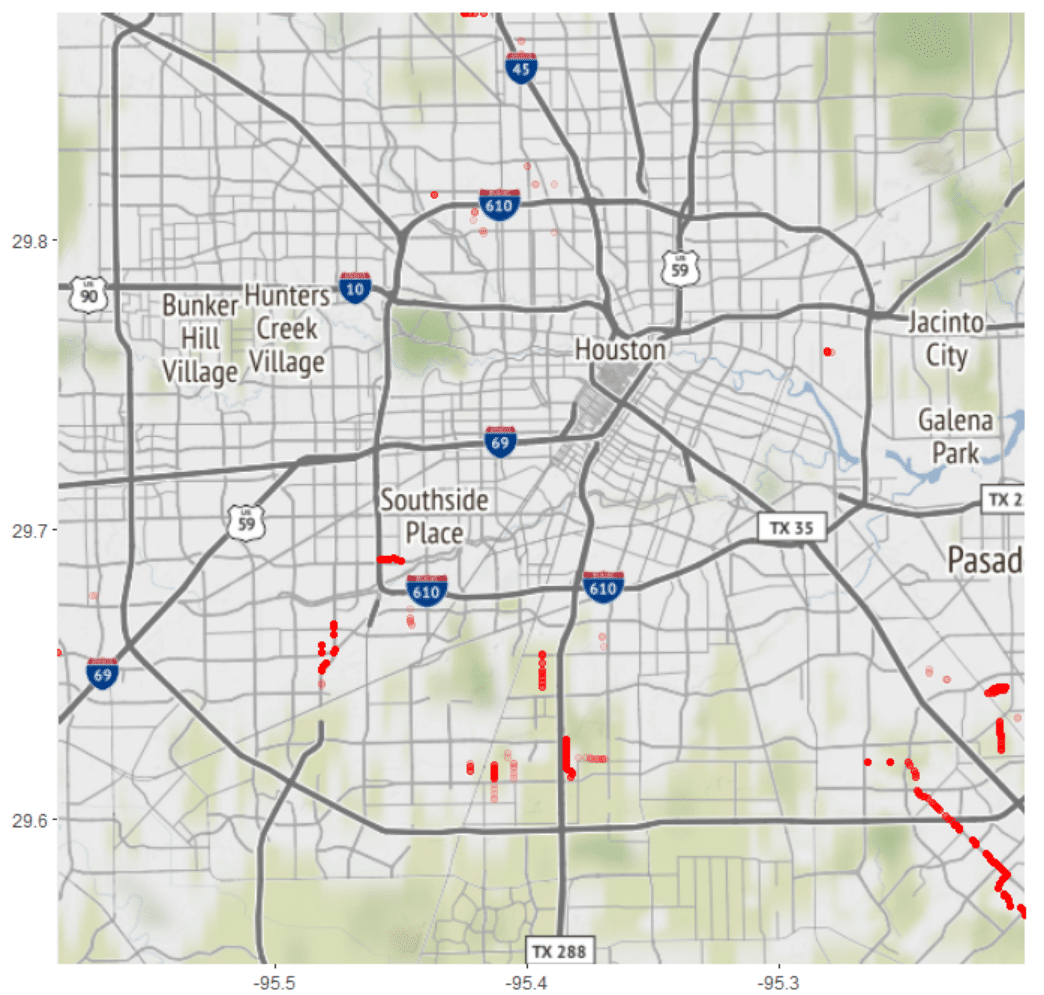
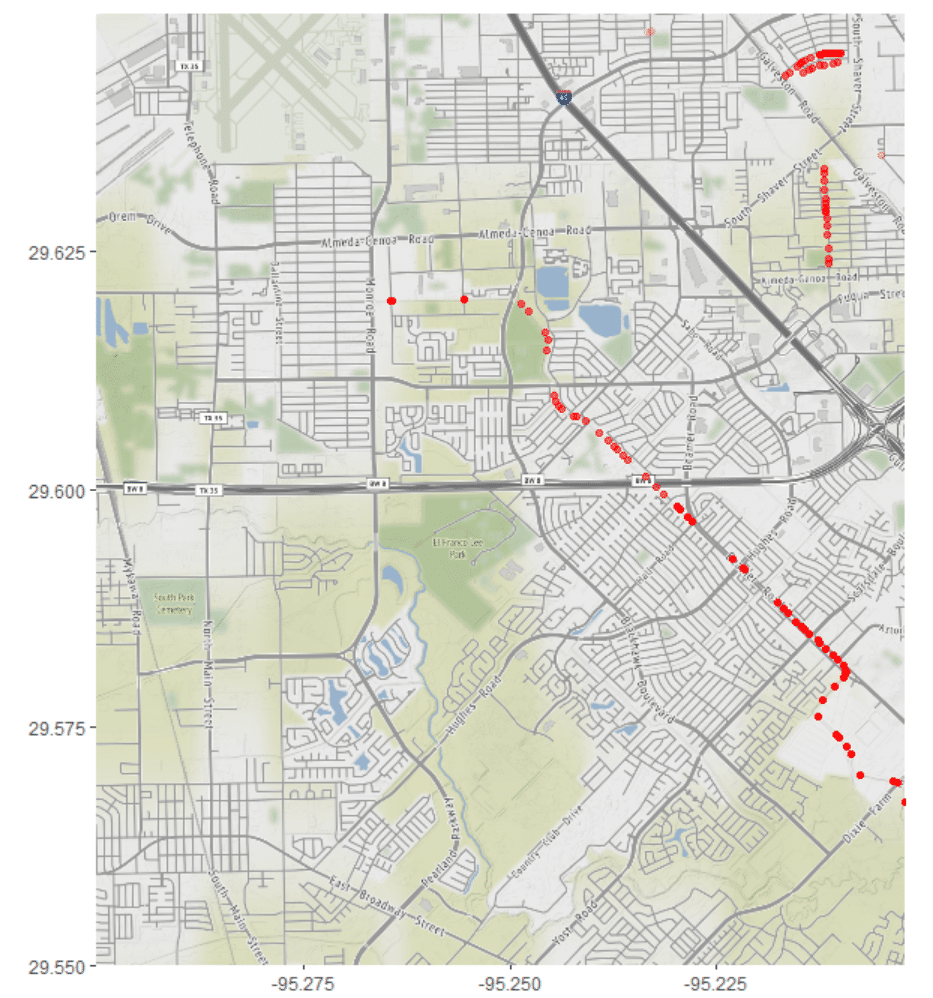
There are more excessive defects in the bottom right corner of the heat map. Let’s take a closer look and pin point these defects. Zooming in we can see that these large defects are in the ditches along Beamer road.
Flood Mapping Technology
City planners looking to combat urban flooding should find this level of detail incredibly useful and proactive instead of reactive. Conventional inspections of defects by experienced engineering inspectors would take about 8 months to document and prioritize the 100 mile long off-road ditch network of Houston. However using 3d laser scanning geovideo technology, Reality IMT was able to visually document, map, and geotag defects in 45 days! Which led to an efficiency improvement of more than 60%
Do you have questions about our geovideo flood mapping?
Reach out to us, we’d be happy to discuss details with you.